Monitor your network interface with SNMP and Logstash

Product Manager at Synapticiel, IT & Telecoms Professional, Interested in ML, AI, IoT, BigData, Cyber Security, RA, FMS, Next Generation BSS/OSS, Mobile Money
What is SNMP ? (This part has been inspired from ManageEngine web site.
Simple Network Management Protocol (SNMP) is an application–layer protocol defined by the Internet Architecture Board (IAB) in RFC1157 for exchanging management information between network devices. It is a part of Transmission Control Protocol⁄Internet Protocol (TCP⁄IP) protocol suite.
SNMP is one of the widely accepted network protocols to manage and monitor network elements. Most of the professional–grade network elements come with bundled SNMP agent. These agents have to be enabled and configured to communicate with the network monitoring tools or network management system (NMS).
SNMP basic components and their functionalities
SNMP consists of :
- SNMP Manager : A manager or management system is a separate entity that is responsible to communicate with the SNMP agent implemented network devices. This is typically a computer that is used to run one or more network management systems.
SNMP Manager’s key functions :
- Queries agents
- Gets responses from agents
- Sets variables in agents
- Acknowledges asynchronous events from agents
In our case, we will be using logstash, with the nice snmp input plugin, to pull data from the snmp agent on the managed device.
Managed Devices : A managed device or the network element is a part of the network that requires some form of monitoring and management e.g. routers, switches, servers, workstations, printers, UPSs, etc...
SNMP Agent : The agent is a program that is packaged within the network element. Enabling the agent allows it to collect the management information database from the device locally and makes it available to the SNMP manager, when it is queried for. These agents could be standard (e.g. Net-SNMP) or specific to a vendor (e.g. HP insight agent)
SNMP agent’s key functions :
- Collects management information about its local environment
- Stores and retrieves management information as defined in the MIB.
- Signals an event to the manager.
- Acts as a proxy for some non–SNMP manageable network node.
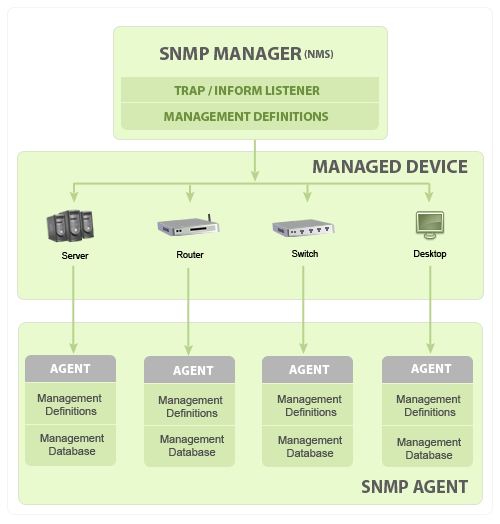
- Management Information database or Management Information Base (MIB)
Every SNMP agent maintains an information database describing the managed device parameters. The SNMP manager uses this database to request the agent for specific information and further translates the information as needed for the Network Management System (NMS). This commonly shared database between the Agent and the Manager is called Management Information Base (MIB).
Typically these MIB contains standard set of statistical and control values defined for hardware nodes on a network. SNMP also allows the extension of these standard values with values specific to a particular agent through the use of private MIBs.
In short, MIB files are the set of questions that a SNMP Manager can ask the agent. Agent collects these data locally and stores it, as defined in the MIB. So, the SNMP Manager should be aware of these standard and private questions for every type of agent.
Using a simple logstash config like this, we can easily pull data from our device on a regular basis :
input {
  snmp {
    tables => [{
                    "name" => "interfaces"
                    "columns" => ["1.3.6.1.2.1.2.2.1.1", "1.3.6.1.2.1.2.2.1.2", "1.3.6.1.2.1.2.2.1.10", "1.3.6.1.2.1.2.2.1.16"]
                }]
    hosts => [{
                host => "udp:127.0.0.1/161"
                community => "public"
                version => "2c"
                retries => 2
                timeout => 1000
              }
            ]
    interval => 5
  }
}

output {
    stdout {}
}
The result looks like this, an array of all interfaces on the devices with selected attributes from the agent MIB.
{
          "host" => "127.0.0.1",
    "interfaces" => [
        [0] {
             "iso.org.dod.internet.mgmt.mib-2.interfaces.ifTable.ifEntry.ifInOctets" => 812249618,
            "iso.org.dod.internet.mgmt.mib-2.interfaces.ifTable.ifEntry.ifOutOctets" => 3093204737,
                                                                             "index" => "1",
                "iso.org.dod.internet.mgmt.mib-2.interfaces.ifTable.ifEntry.ifIndex" => 1,
                "iso.org.dod.internet.mgmt.mib-2.interfaces.ifTable.ifEntry.ifDescr" => "FastEthernet0/0"
        },
        [1] {
             "iso.org.dod.internet.mgmt.mib-2.interfaces.ifTable.ifEntry.ifInOctets" => 2431688168,
            "iso.org.dod.internet.mgmt.mib-2.interfaces.ifTable.ifEntry.ifOutOctets" => 438889274,
                                                                             "index" => "2",
                "iso.org.dod.internet.mgmt.mib-2.interfaces.ifTable.ifEntry.ifIndex" => 2,
                "iso.org.dod.internet.mgmt.mib-2.interfaces.ifTable.ifEntry.ifDescr" => "FastEthernet1/0"
        },
        [2] {
             "iso.org.dod.internet.mgmt.mib-2.interfaces.ifTable.ifEntry.ifInOctets" => 877744609,
            "iso.org.dod.internet.mgmt.mib-2.interfaces.ifTable.ifEntry.ifOutOctets" => 447410155,
                                                                             "index" => "3",
                "iso.org.dod.internet.mgmt.mib-2.interfaces.ifTable.ifEntry.ifIndex" => 3,
                "iso.org.dod.internet.mgmt.mib-2.interfaces.ifTable.ifEntry.ifDescr" => "FastEthernet2/0"
        },
        [3] {
             "iso.org.dod.internet.mgmt.mib-2.interfaces.ifTable.ifEntry.ifInOctets" => 382207741,
            "iso.org.dod.internet.mgmt.mib-2.interfaces.ifTable.ifEntry.ifOutOctets" => 760358,
                                                                             "index" => "4",
                "iso.org.dod.internet.mgmt.mib-2.interfaces.ifTable.ifEntry.ifIndex" => 4,
                "iso.org.dod.internet.mgmt.mib-2.interfaces.ifTable.ifEntry.ifDescr" => "FastEthernet3/0"
        },
        [4] {
             "iso.org.dod.internet.mgmt.mib-2.interfaces.ifTable.ifEntry.ifInOctets" => 2438113932,
            "iso.org.dod.internet.mgmt.mib-2.interfaces.ifTable.ifEntry.ifOutOctets" => 392582221,
                                                                             "index" => "5",
                "iso.org.dod.internet.mgmt.mib-2.interfaces.ifTable.ifEntry.ifIndex" => 5,
                "iso.org.dod.internet.mgmt.mib-2.interfaces.ifTable.ifEntry.ifDescr" => "FastEthernet4/0"
        }
    ],
      "@version" => "1",
    "@timestamp" => 2020-12-17T14:12:34.594Z
}
That is, of course, fairly useless for analysis if we areusing the patterns we generally use with events from other sources. So ideally, we'd like to have something like this :
{
  "@timestamp": "2020-12-17T13:08:37.158Z",
  "host": "127.0.0.1",
  "ifIndex": 1,
  "ifDescr": "FastEthernet0/0",
  "ifInOctets": 316876067,
  "ifOutOctets": 150562
}
The mutate filter provide multiple possibilities to transform the data, one of them is the split function that will allow us to get multiple events from the array, means 1 event for each interface.
Following is a complete logstash configuration that allow to transform the data and send it back to elasticsearch for analysis
input {
  snmp {
    tables => [{
                    "name" => "interfaces"
                    "columns" => ["1.3.6.1.2.1.2.2.1.1", "1.3.6.1.2.1.2.2.1.2", "1.3.6.1.2.1.2.2.1.10", "1.3.6.1.2.1.2.2.1.16"]
                }]
    hosts => [{
                host => "udp:127.0.0.1/161"
                community => "public"
                version => "2c"
                retries => 2
                timeout => 1000
              }
            ]
    interval => 5
  }
}

filter {

split {
   field => "interfaces"
 }

mutate {
        rename => { "[interfaces][index]" => "index" }
        rename => { "[interfaces][iso.org.dod.internet.mgmt.mib-2.interfaces.ifTable.ifEntry.ifIndex]" => "ifIndex" }
        rename => { "[interfaces][iso.org.dod.internet.mgmt.mib-2.interfaces.ifTable.ifEntry.ifDescr]" => "ifDescr" }
        rename => { "[interfaces][iso.org.dod.internet.mgmt.mib-2.interfaces.ifTable.ifEntry.ifInOctets]" => "ifInOctets" }
        rename => { "[interfaces][iso.org.dod.internet.mgmt.mib-2.interfaces.ifTable.ifEntry.ifOutOctets]" => "ifOutOctets" }
    }

mutate {
        convert => {
          "ifInOctets" => "integer"
          "ifOutOctets" => "integer"
        }
    }

mutate {
        remove_field => [ "interfaces", "@version" ]
      }
}

output {
   elasticsearch {
    hosts => ["https://localhost:9200"]
    user => "elastic"
    password => "changeme"
    cacert => "/opt/logstash_snmp/ca.crt"
    ssl => true
    index => "snmp-logs-%{+YYYY-MM-dd}"
    action => "index"
}
}
The following is an example of index template that can be used to host the date pulled by logstash
PUT _template/snmp-logs
{
  "index_patterns": [
    "snmp-logs-*"
  ],
  "settings": {
    "number_of_shards": 1,
    "number_of_replicas": 0
  },
  "mappings": {
    "properties": {
      "@timestamp": {
        "type": "date"
      },
      "host": {
        "type": "keyword"
      },
      "ifDescr": {
        "type": "keyword"
      },
      "ifInOctets": {
        "type": "long"
      },
      "ifIndex": {
        "type": "long"
      },
      "ifOutOctets": {
        "type": "long"
      },
      "index": {
        "type": "integer"
      }
    }
  }
}
Of course, the template will depend on the snmp table attributed selected
For example if you want to get all interfaces on the devices with all attribute, we to pull data from the table OID : .1.3.6.1.2.1.2.2 and apply all the necessary renaming on logstash filter to get all required attributes
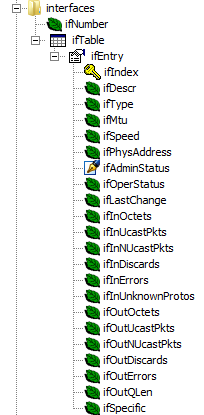
You can correlate all OIDs to an interface name below by snmp walking ifName: 1.3.6.1.2.1.31.1.1.1.1
High Speed interfaces
For high-speed interfaces (100Mbps or above) you should use 64-bit counters if the device supports them :
- ifHCInOctets: 1.3.6.1.2.1.31.1.1.1.6 (64-bit Octets in counter)
- ifHCOutOctets: 1.3.6.1.2.1.31.1.1.1.10 (64-bit Octets out counter)
- ifHCInUcastPkts: 1.3.6.1.2.1.31.1.1.1.7 (64-bit Packets in counter)
- ifHCOutUcastPkts: 1.3.6.1.2.1.31.1.1.1.11 (64-bit Packets out counter)
- ifHighSpeed: 1.3.6.1.2.1.31.1.1.1.15 (An estimate of the interface's current bandwidth in units of 1Mbps)
Low Speed interfaces
Lower speed interfaces can get by with 32-bit counters. If you use 32-bit counters on high-speed interfaces, they can wrap quickly; a 10 Mbps stream of back-to-back, full-size packets causes ifInOctets to wrap in just over 57 minutes. At 100 Mbps, the minimum wrap time is 5.7 minutes, and at 1 Gbps, the minimum is 34 seconds Note 1
- ifInOctets: 1.3.6.1.2.1.2.2.1.10 (32-bit Octets in counter)
- ifOutOctets: 1.3.6.1.2.1.2.2.1.16 (32-bit Octets out counter)
- ifInUcastPkts: 1.3.6.1.2.1.2.2.1.11 (32-bit Packets in counter)
- ifOutUcastPkts: 1.3.6.1.2.1.2.2.1.17 (32-bit Packets out counter)
- ifSpeed: 1.3.6.1.2.1.2.2.1.5 (Currently negotiated speed of the interface - Max: 4.294 Gbps)
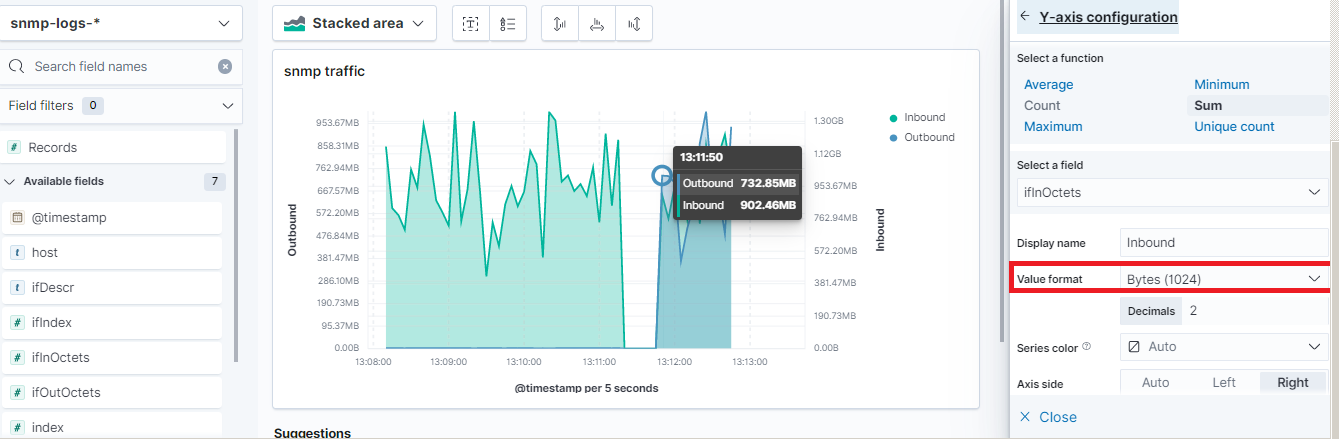
Once done, and data is inside elasticsearch, you can laverage different analytics using lens in Kibana :