

Vega declarative grammar is a powerful way to visualize your data. Since Kibana 6.2, you can build rich Vega and Vega-Lite visualizations with your Elasticsearch data.
A radar chart is a graphical method of displaying multivariate data in the form of a two-dimensional chart of three or more quantitative variables represented on axes starting from the same point.
In this blog post, i will show how to use vega with Kibana to build a radar chart using dynamics data from any elasticsearch index. I will use the exmaple provided in vega website and show how to convert it to Kibana visualization
Let's create a small index with some data
PUT radar
{
  "settings": {
    "number_of_shards": 1,
    "number_of_replicas": 0
  },
  "mappings": {
    "properties": {
      "@timestamp": {
        "type": "date"
      },
      "key": {
        "type": "keyword"
      },
      "category": {
        "type": "keyword"
      },
      "value": {
        "type": "integer"
      }
    }
  }
}
Use the following _bulk command to add a set of data into our index
POST _bulk
{"index":{"_index":"radar"}}
{"key":"key-0","value":19,"category":0}
{"index":{"_index":"radar"}}
{"key":"key-1","value":22,"category":0}
{"index":{"_index":"radar"}}
{"key":"key-2","value":14,"category":0}
{"index":{"_index":"radar"}}
{"key":"key-3","value":38,"category":0}
{"index":{"_index":"radar"}}
{"key":"key-4","value":23,"category":0}
{"index":{"_index":"radar"}}
{"key":"key-5","value":5,"category":0}
{"index":{"_index":"radar"}}
{"key":"key-6","value":27,"category":0}
{"index":{"_index":"radar"}}
{"key":"key-7","value":21,"category":0}
{"index":{"_index":"radar"}}
{"key":"key-0","value":13,"category":1}
{"index":{"_index":"radar"}}
{"key":"key-1","value":12,"category":1}
{"index":{"_index":"radar"}}
{"key":"key-2","value":42,"category":1}
{"index":{"_index":"radar"}}
{"key":"key-3","value":13,"category":1}
{"index":{"_index":"radar"}}
{"key":"key-4","value":6,"category":1}
{"index":{"_index":"radar"}}
{"key":"key-5","value":15,"category":1}
{"index":{"_index":"radar"}}
{"key":"key-6","value":8,"category":1}
{"index":{"_index":"radar"}}
{"key":"key-7","value":8,"category":1}
I will use the following update_script just to get data looks timeseries :) this will help us later to demo how to access the context of Kibana TopNavBar (Mainy query, filter and time date range) to be applied.
POST radar/_update_by_query
{
  "script": {
              "source" : """
              DateFormat df = new SimpleDateFormat("yyyy-MM-dd'T'HH:mm:ss.SSS'Z'");
              df.setTimeZone(TimeZone.getTimeZone("UTC+1"));
              Date date = new Date();
              ctx._source['@timestamp'] = df.format(date);
              """,

    "lang": "painless"
  },

  "query": {
    "match_all": {}
  }
}
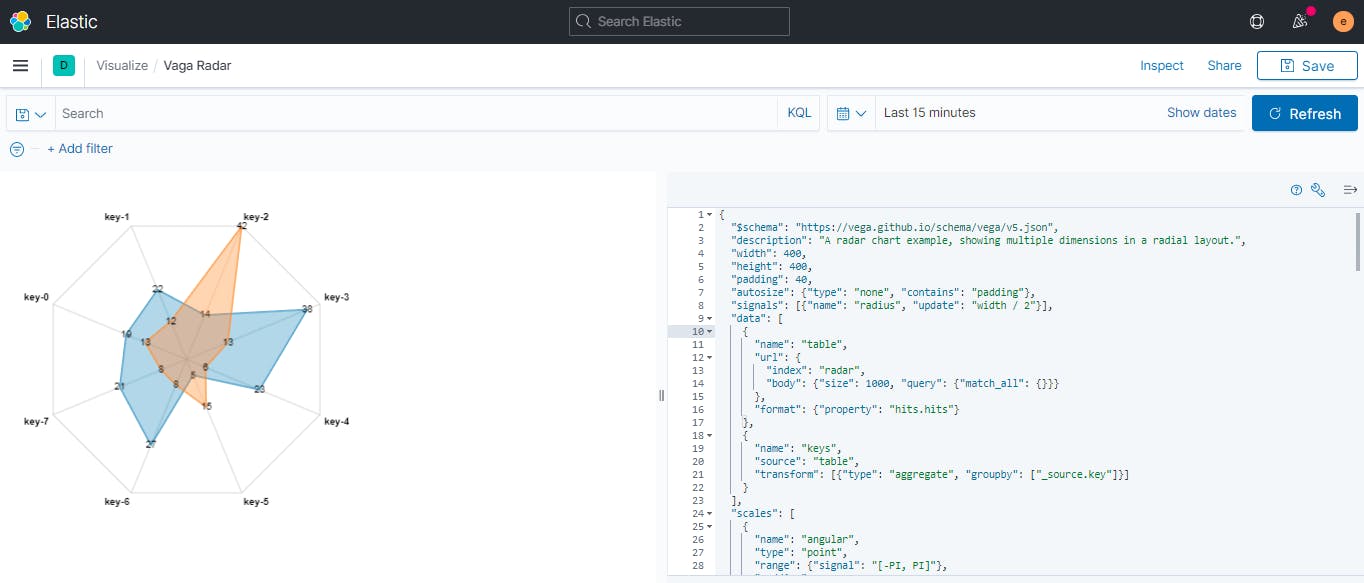
The following is a complete reproduction of vega example with Elasticsearch data
{
  "$schema": "https://vega.github.io/schema/vega/v5.json",
  "description": "A radar chart example, showing multiple dimensions in a radial layout.",
  "width": 400,
  "height": 400,
  "padding": 40,
  "autosize": {"type": "none", "contains": "padding"},
  "signals": [{"name": "radius", "update": "width / 2"}],
  "data": [
    {
      "name": "table",
      "url": {
        "index": "radar",
        "body": {"size": 1000, "query": {"match_all": {}}}
      },
      "format": {"property": "hits.hits"}
    },
    {
      "name": "keys",
      "source": "table",
      "transform": [{"type": "aggregate", "groupby": ["_source.key"]}]
    }
  ],
  "scales": [
    {
      "name": "angular",
      "type": "point",
      "range": {"signal": "[-PI, PI]"},
      "padding": 0.5,
      "domain": {"data": "table", "field": "_source.key"}
    },
    {
      "name": "radial",
      "type": "linear",
      "range": {"signal": "[0, radius]"},
      "zero": true,
      "nice": false,
      "domain": {"data": "table", "field": "_source.value"},
      "domainMin": 0
    },
    {
      "name": "color",
      "type": "ordinal",
      "domain": {"data": "table", "field": "_source.category"},
      "range": {"scheme": "category10"}
    }
  ],
  "encode": {"enter": {"x": {"signal": "radius"}, "y": {"signal": "radius"}}},
  "marks": [
    {
      "type": "group",
      "name": "categories",
      "zindex": 1,
      "from": {
        "facet": {
          "data": "table",
          "name": "facet",
          "groupby": ["_source.category"]
        }
      },
      "marks": [
        {
          "type": "line",
          "name": "category-line",
          "from": {"data": "facet"},
          "encode": {
            "enter": {
              "interpolate": {"value": "linear-closed"},
              "x": {
                "signal": "scale('radial', datum._source.value) * cos(scale('angular', datum._source.key))"
              },
              "y": {
                "signal": "scale('radial', datum._source.value) * sin(scale('angular', datum._source.key))"
              },
              "stroke": {"scale": "color", "field": "_source.category"},
              "strokeWidth": {"value": 1},
              "fill": {"scale": "color", "field": "_source.category"},
              "fillOpacity": {"value": 0.3}
            }
          }
        },
        {
          "type": "text",
          "name": "value-text",
          "from": {"data": "category-line"},
          "encode": {
            "enter": {
              "x": {"signal": "datum.x"},
              "y": {"signal": "datum.y"},
              "text": {"signal": "datum.datum._source.value"},
              "align": {"value": "center"},
              "baseline": {"value": "middle"},
              "fill": {"value": "black"}
            }
          }
        }
      ]
    },
    {
      "type": "rule",
      "name": "radial-grid",
      "from": {"data": "keys"},
      "zindex": 0,
      "encode": {
        "enter": {
          "x": {"value": 0},
          "y": {"value": 0},
          "x2": {
            "signal": "radius * cos(scale('angular', datum['_source.key']))"
          },
          "y2": {
            "signal": "radius * sin(scale('angular', datum['_source.key']))"
          },
          "stroke": {"value": "lightgray"},
          "strokeWidth": {"value": 1}
        }
      }
    },
    {
      "type": "text",
      "name": "key-label",
      "from": {"data": "keys"},
      "zindex": 1,
      "encode": {
        "enter": {
          "x": {
            "signal": "(radius + 5) * cos(scale('angular', datum['_source.key']))"
          },
          "y": {
            "signal": "(radius + 5) * sin(scale('angular', datum['_source.key']))"
          },
          "text": {"field": "_source\\.key"},
          "align": [
            {
              "test": "abs(scale('angular', datum['_source.key'])) > PI / 2",
              "value": "right"
            },
            {"value": "left"}
          ],
          "baseline": [
            {
              "test": "scale('angular', datum['_source.key']) > 0",
              "value": "top"
            },
            {
              "test": "scale('angular', datum['_source.key']) == 0",
              "value": "middle"
            },
            {"value": "bottom"}
          ],
          "fill": {"value": "black"},
          "fontWeight": {"value": "bold"}
        }
      }
    },
    {
      "type": "line",
      "name": "outer-line",
      "from": {"data": "radial-grid"},
      "encode": {
        "enter": {
          "interpolate": {"value": "linear-closed"},
          "x": {"field": "x2"},
          "y": {"field": "y2"},
          "stroke": {"value": "lightgray"},
          "strokeWidth": {"value": 1}
        }
      }
    }
  ]
}
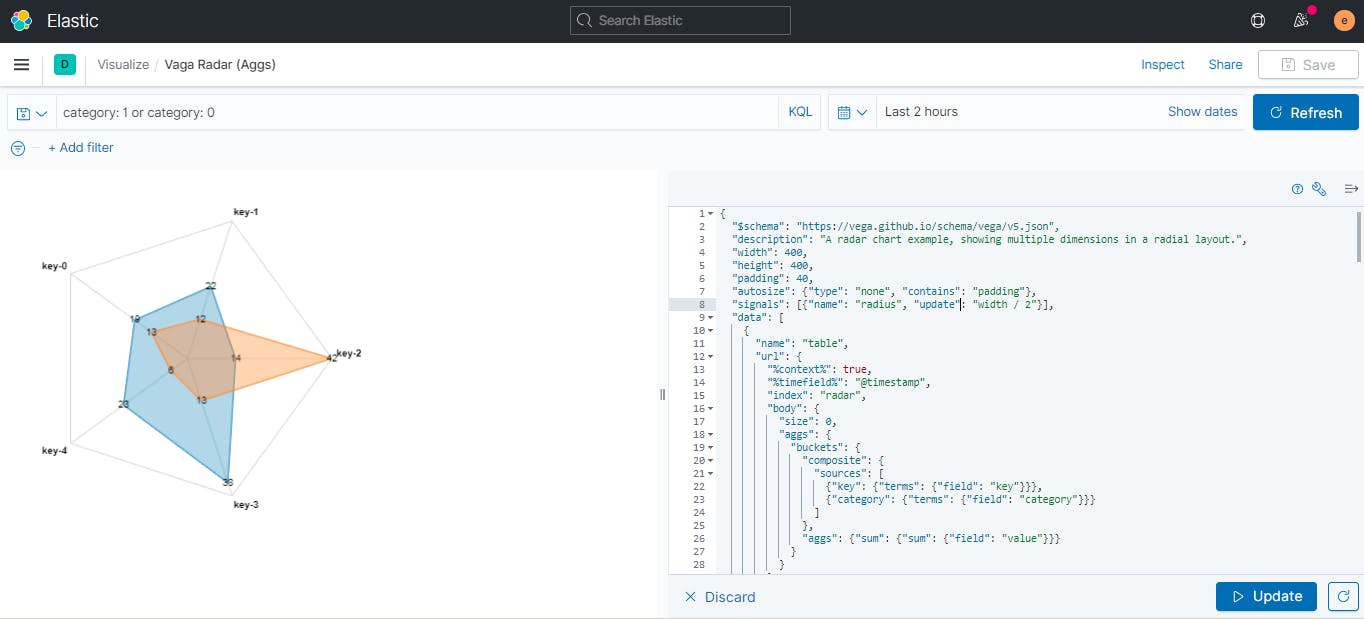
The First example use a simple elasticsearch query to get events directly into the visualization, the next example is more dynamic and bring the data of elasticsearch aggregation(Composite Aggregation) with dynamic context
{
  "$schema": "https://vega.github.io/schema/vega/v5.json",
  "description": "A radar chart example, showing multiple dimensions in a radial layout.",
  "width": 400,
  "height": 400,
  "padding": 40,
  "autosize": {"type": "none", "contains": "padding"},
  "signals": [{"name": "radius", "update": "width / 2"}],
  "data": [
    {
      "name": "table",
      "url": {
        "%context%": true,
        "%timefield%": "@timestamp",
        "index": "radar",
        "body": {
          "size": 0,
          "aggs": {
            "buckets": {
              "composite": {
                "sources": [
                  {"key": {"terms": {"field": "key"}}},
                  {"category": {"terms": {"field": "category"}}}
                ]
              },
              "aggs": {"sum": {"sum": {"field": "value"}}}
            }
          }
        }
      },
      "format": {"property": "aggregations.buckets.buckets"}
    },
    {
      "name": "keys",
      "source": "table",
      "transform": [{"type": "aggregate", "groupby": ["key.key"]}]
    }
  ],
  "scales": [
    {
      "name": "angular",
      "type": "point",
      "range": {"signal": "[-PI, PI]"},
      "padding": 0.5,
      "domain": {"data": "table", "field": "key.key"}
    },
    {
      "name": "radial",
      "type": "linear",
      "range": {"signal": "[0, radius]"},
      "zero": true,
      "nice": false,
      "domain": {"data": "table", "field": "sum.value"},
      "domainMin": 0
    },
    {
      "name": "color",
      "type": "ordinal",
      "domain": {"data": "table", "field": "key.category"},
      "range": {"scheme": "category10"}
    }
  ],
  "encode": {"enter": {"x": {"signal": "radius"}, "y": {"signal": "radius"}}},
  "marks": [
    {
      "type": "group",
      "name": "categories",
      "zindex": 1,
      "from": {
        "facet": {"data": "table", "name": "facet", "groupby": ["key.category"]}
      },
      "marks": [
        {
          "type": "line",
          "name": "category-line",
          "from": {"data": "facet"},
          "encode": {
            "enter": {
              "interpolate": {"value": "linear-closed"},
              "x": {
                "signal": "scale('radial', datum.sum.value) * cos(scale('angular', datum.key.key))"
              },
              "y": {
                "signal": "scale('radial', datum.sum.value) * sin(scale('angular', datum.key.key))"
              },
              "stroke": {"scale": "color", "field": "key.category"},
              "strokeWidth": {"value": 1},
              "fill": {"scale": "color", "field": "key.category"},
              "fillOpacity": {"value": 0.3}
            }
          }
        },
        {
          "type": "text",
          "name": "value-text",
          "from": {"data": "category-line"},
          "encode": {
            "enter": {
              "x": {"signal": "datum.x"},
              "y": {"signal": "datum.y"},
              "text": {"signal": "datum.datum.sum.value"},
              "align": {"value": "center"},
              "baseline": {"value": "middle"},
              "fill": {"value": "black"}
            }
          }
        }
      ]
    },
    {
      "type": "rule",
      "name": "radial-grid",
      "from": {"data": "keys"},
      "zindex": 0,
      "encode": {
        "enter": {
          "x": {"value": 0},
          "y": {"value": 0},
          "x2": {"signal": "radius * cos(scale('angular', datum['key.key']))"},
          "y2": {"signal": "radius * sin(scale('angular', datum['key.key']))"},
          "stroke": {"value": "lightgray"},
          "strokeWidth": {"value": 1}
        }
      }
    },
    {
      "type": "text",
      "name": "key-label",
      "from": {"data": "keys"},
      "zindex": 1,
      "encode": {
        "enter": {
          "x": {
            "signal": "(radius + 5) * cos(scale('angular', datum['key.key']))"
          },
          "y": {
            "signal": "(radius + 5) * sin(scale('angular', datum['key.key']))"
          },
          "text": {"field": "key\\.key"},
          "align": [
            {
              "test": "abs(scale('angular', datum['key.key'])) > PI / 2",
              "value": "right"
            },
            {"value": "left"}
          ],
          "baseline": [
            {"test": "scale('angular', datum['key.key']) > 0", "value": "top"},
            {"test": "scale('angular', datum['key']) == 0", "value": "middle"},
            {"value": "bottom"}
          ],
          "fill": {"value": "black"},
          "fontWeight": {"value": "bold"}
        }
      }
    },
    {
      "type": "line",
      "name": "outer-line",
      "from": {"data": "radial-grid"},
      "encode": {
        "enter": {
          "interpolate": {"value": "linear-closed"},
          "x": {"field": "x2"},
          "y": {"field": "y2"},
          "stroke": {"value": "lightgray"},
          "strokeWidth": {"value": 1}
        }
      }
    }
  ]
}