How to calculate bandwidth use with SNMP and Logstash

Product Manager at Synapticiel, IT & Telecoms Professional, Interested in ML, AI, IoT, BigData, Cyber Security, RA, FMS, Next Generation BSS/OSS, Mobile Money
This article was inspired from Cisco Blog
How we calculate the bandwidth use depends on how data is presented for what we want to measure. Interface use is the primary measure used for network use. Use this formulas, based on whether the connection you measure is half-duplex or full-duplex. Shared LAN connections tend to be half-duplex, mainly because contention detection requires that a device listen before it transmits. WAN connections are full-duplex because the connection is point-to-point; both devices can transmit and receive at the same time because they know there is only one other device that shares the connection. Because MIB-II variables are stored as counters, we must take two poll cycles and figure the difference between the two (hence, the delta used in the equation).
This explains the variables used in the formulas :
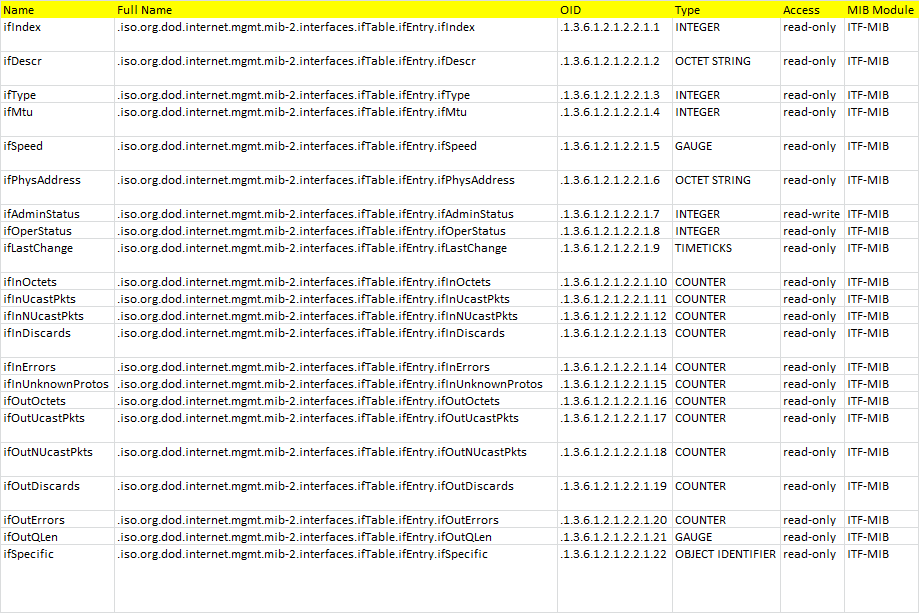
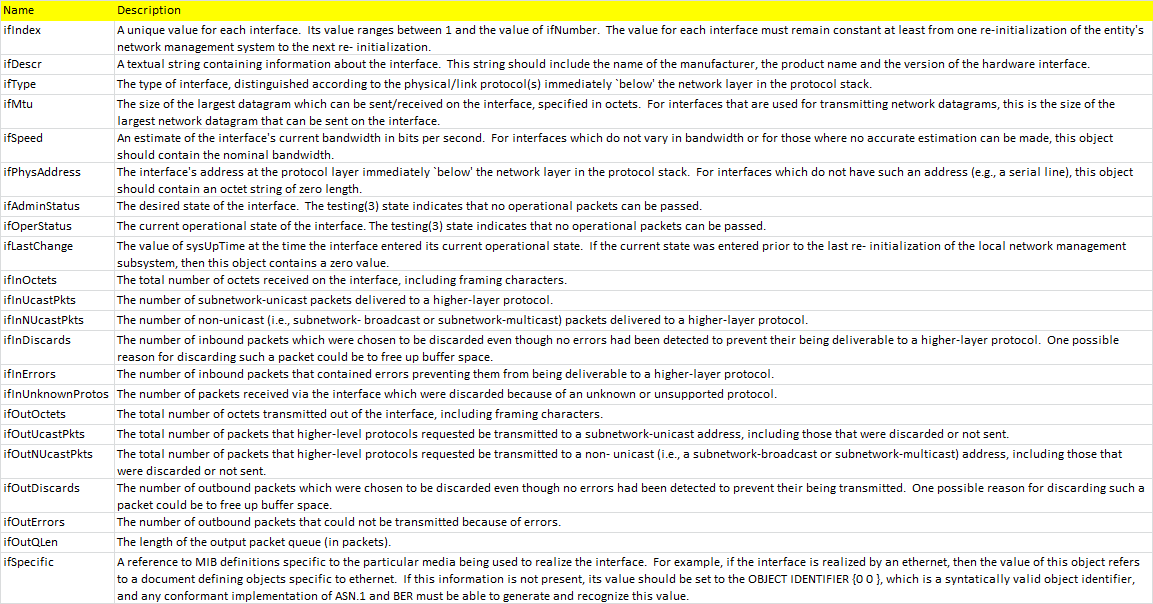
- Difference(ifInOctets) : The difference between two poll cycles of collecting the snmp counter 'ifInOctets' object, which represents the count of inbound octets of traffic
- Difference(ifIOutOctets) : The difference between two poll cycles of collecting the snmp counter 'ifOutOctets' object, which represents the count of outbound octets of traffic
- ifSpeed : the speed of the interface as reported by the snmp object 'ifSpeed'
Note: ifSpeed does not accurately reflect the speed of a WAN interface.
For half-duplex media, use this formula for interface use :
(Difference(ifInOctets) + Difference(ifIOutOctets)) * 8 * 100
----------------------------------------------------------------
(Number of seconds between the two poll cycles) * ifSpeed
It is more challenging to calculate for full-duplex media. For example, with a full T-1 serial connection, the line speed is 1.544 Mbps. Therefore, a T-1 interface can both receive and transmit 1.544 Mbps for a combined possible bandwidth of 3.088 Mbps
When you calculate the interface bandwidth for full-duplex connections, you can use this formula, where you take the larger of the in and out values and generate a use percentage :
MAX(Difference(ifInOctets), Difference(ifIOutOctets)) * 8 * 100
-------------------------------------------------------------------
(Number of seconds between the two poll cycles) * ifSpeed
However, this method hides the use of the direction with the lesser value and provides less accurate results. A more accurate method is to measure the input use and output use separately, with this formula :
                               Difference(ifInOctets) * 8 * 100
Inbound Utilization = ------------------------------------------------------------
                     (Number of seconds between the two poll cycles) * ifSpeed


                               Difference(ifIOutOctets) * 8 * 100
Outbound Utilization = ------------------------------------------------------------
                     (Number of seconds between the two poll cycles) * ifSpeed
These formulas are simplified because they do not consider overhead associated with the protocol. For example, refer to RFC 1757 Ethernet-utilization formulas that consider packet overhead.
Now let's see how we can put together theses formulas using logstash. For more info on how to use logstash to pull snmp events, refer to our previous blog post Monitor your network interface with SNMP and Logstash .
Warning
SNMP values ifInOctets and ifOutOctets are counters that the device increments with the frame length every time a frame is received or sent, it is not a rate on its own. To get a data rate out of it, we need regular sampling, and we need to know what the counter value was at the previous sample time and what the time interval was between the samples.
(sample.current - sample.previous) / sampleseconds gets our average bytes-per-second over the interval.
If we are going to be doing this for long-term, we will need to detect when the counter wraps back around to 0 or resets due to host/device restart. And while we're on the subject, we want also the 64-bit counters ifHCInOctets and ifHCOutOctets when available; the 32-bit counter will wrap every 5 minutes at around 118Mb/s making our numbers unreliable at high throughput / low sample rates.
Step 1 : Configure poll cycles
The following example of SNMP input plugin will poll the date from network devices every minute
input {
  snmp {
    tables => [{
                "name" => "ifTable"
                "columns" => ["1.3.6.1.2.1.2.2.1.1","1.3.6.1.2.1.2.2.1.2","1.3.6.1.2.1.2.2.1.3","1.3.6.1.2.1.2.2.1.4","1.3.6.1.2.1.2.2.1.5","1.3.6.1.2.1.2.2.1.6","1.3.6.1.2.1.2.2.1.7","1.3.6.1.2.1.2.2.1.8","1.3.6.1.2.1.2.2.1.9","1.3.6.1.2.1.2.2.1.10","1.3.6.1.2.1.2.2.1.11","1.3.6.1.2.1.2.2.1.12","1.3.6.1.2.1.2.2.1.13","1.3.6.1.2.1.2.2.1.14","1.3.6.1.2.1.2.2.1.15","1.3.6.1.2.1.2.2.1.16","1.3.6.1.2.1.2.2.1.17","1.3.6.1.2.1.2.2.1.18","1.3.6.1.2.1.2.2.1.19","1.3.6.1.2.1.2.2.1.20","1.3.6.1.2.1.2.2.1.21","1.3.6.1.2.1.2.2.1.22"]
                }]
    hosts => [{
                host => "udp:10.10.10.10/161" community => "public"  version => "2c"  retries => 2  timeout => 1000
              }]
    interval => 60
    oid_root_skip => 9
    add_field => { "device_ip" => "%{[@metadata][host_address]}" "device_name" => "Casablanca 20250 MA5600T" "location" => "33.565065, -7.634784"}
  }
  snmp {
    tables => [{
                "name" => "ifTable"
                "columns" => ["1.3.6.1.2.1.2.2.1.1","1.3.6.1.2.1.2.2.1.2","1.3.6.1.2.1.2.2.1.3","1.3.6.1.2.1.2.2.1.4","1.3.6.1.2.1.2.2.1.5","1.3.6.1.2.1.2.2.1.6","1.3.6.1.2.1.2.2.1.7","1.3.6.1.2.1.2.2.1.8","1.3.6.1.2.1.2.2.1.9","1.3.6.1.2.1.2.2.1.10","1.3.6.1.2.1.2.2.1.11","1.3.6.1.2.1.2.2.1.12","1.3.6.1.2.1.2.2.1.13","1.3.6.1.2.1.2.2.1.14","1.3.6.1.2.1.2.2.1.15","1.3.6.1.2.1.2.2.1.16","1.3.6.1.2.1.2.2.1.17","1.3.6.1.2.1.2.2.1.18","1.3.6.1.2.1.2.2.1.19","1.3.6.1.2.1.2.2.1.20","1.3.6.1.2.1.2.2.1.21","1.3.6.1.2.1.2.2.1.22"]
                }]
    hosts => [{
                host => "udp:10.10.10.11/161" community => "public"  version => "2c"  retries => 2  timeout => 1000
              }]
    interval => 60
    oid_root_skip => 9
    add_field => { "device_ip" => "%{[@metadata][host_address]}" "device_name" => "Casablanca 20251 MA5600T" "location" => "33.566214, -7.632437"}
  }
}
The following attributes will be polled for each interface of each device
{
  "@timestamp": "2020-12-21T15:01:44.441Z",
  "device_name": "Casablanca 20251 MA5600T",
  "device_ip": "10.10.10.11",
  "location": "33.566214, -7.632437",
  "ifIndex": 6,
  "ifDescr": "Vlan203",
  "ifType": 6,
  "ifPhysAddress": "00:01:97:22:a3:b8",
  "ifSpeed": 1000000000,
  "ifInOctets": 7144724480,
  "ifOutOctets": 4734465402,
  "ifSpecific": "0.0",
  "ifOutUcastPkts": 15922017,
  "ifOutDiscards": 0,
  "ifLastChange": 5500,
  "ifOutQLen": 0,
  "ifMtu": 1500,
  "ifInUnknownProtos": 5546,
  "ifOutErrors": 0,
  "ifInDiscards": 141,
  "ifOutNUcastPkts": 0,
  "ifOperStatus": 1,
  "ifAdminStatus": 1,
  "ifInUcastPkts": 193985,
  "ifInNUcastPkts": 193263846,
  "ifInErrors": 0
}
Now as we need to compute the bandwidth utilization for each interface, we need to get the last cycle stored in elasticsearch, and for this we will use Elasticsearch filter
elasticsearch {
            hosts => ["https://localhost:9200"]
            user => "elastic"
            password => "changeme"
            index => "snmp-logs-metrics-*"
            ca_file => "/opt/logstash_snmp/ca.crt"
            query_template => "query_ifIndex_template.json"
            fields => { "@timestamp" => "lastPollCycleTimestamp" "ifInOctets" => "lastPollCycleIfInOctets" "ifOutOctets" => "lastPollCycleIfOutOctets"}
      }
The following query template is used to get the latest cycle attributes based on ifIndex and device_ip
{
  "size": 1,
  "query": {
    "bool": {
      "must": [
        {
          "match": {
            "ifIndex": "%{ifIndex}"
          }
        },
        {
          "match": {
            "device_ip": "%{device_ip}"
          }
        }
      ]
    }
  },
  "sort": [
    {
      "@timestamp": {
        "order": "desc"
      }
    }
  ]
}
And now we have the new data polled from the device and the latest cycle stored in elasticsearch, we can apply our formula using ruby filter to compute necessary metrics
input {
  snmp {
    tables => [{
                "name" => "ifTable"
                "columns" => ["1.3.6.1.2.1.2.2.1.1","1.3.6.1.2.1.2.2.1.2","1.3.6.1.2.1.2.2.1.3","1.3.6.1.2.1.2.2.1.4","1.3.6.1.2.1.2.2.1.5","1.3.6.1.2.1.2.2.1.6","1.3.6.1.2.1.2.2.1.7","1.3.6.1.2.1.2.2.1.8","1.3.6.1.2.1.2.2.1.9","1.3.6.1.2.1.2.2.1.10","1.3.6.1.2.1.2.2.1.11","1.3.6.1.2.1.2.2.1.12","1.3.6.1.2.1.2.2.1.13","1.3.6.1.2.1.2.2.1.14","1.3.6.1.2.1.2.2.1.15","1.3.6.1.2.1.2.2.1.16","1.3.6.1.2.1.2.2.1.17","1.3.6.1.2.1.2.2.1.18","1.3.6.1.2.1.2.2.1.19","1.3.6.1.2.1.2.2.1.20","1.3.6.1.2.1.2.2.1.21","1.3.6.1.2.1.2.2.1.22"]
                }]
    hosts => [{
                host => "udp:10.10.10.10/161" community => "public"  version => "2c"  retries => 2  timeout => 1000
              }]
    interval => 60
    oid_root_skip => 9
    add_field => { "device_ip" => "%{[@metadata][host_address]}" "device_name" => "Casablanca 20250 MA5600T" "location" => "33.565065, -7.634784"}
  }
  snmp {
    tables => [{
                "name" => "ifTable"
                "columns" => ["1.3.6.1.2.1.2.2.1.1","1.3.6.1.2.1.2.2.1.2","1.3.6.1.2.1.2.2.1.3","1.3.6.1.2.1.2.2.1.4","1.3.6.1.2.1.2.2.1.5","1.3.6.1.2.1.2.2.1.6","1.3.6.1.2.1.2.2.1.7","1.3.6.1.2.1.2.2.1.8","1.3.6.1.2.1.2.2.1.9","1.3.6.1.2.1.2.2.1.10","1.3.6.1.2.1.2.2.1.11","1.3.6.1.2.1.2.2.1.12","1.3.6.1.2.1.2.2.1.13","1.3.6.1.2.1.2.2.1.14","1.3.6.1.2.1.2.2.1.15","1.3.6.1.2.1.2.2.1.16","1.3.6.1.2.1.2.2.1.17","1.3.6.1.2.1.2.2.1.18","1.3.6.1.2.1.2.2.1.19","1.3.6.1.2.1.2.2.1.20","1.3.6.1.2.1.2.2.1.21","1.3.6.1.2.1.2.2.1.22"]
                }]
    hosts => [{
                host => "udp:10.10.10.11/161" community => "public"  version => "2c"  retries => 2  timeout => 1000
              }]
    interval => 60
    oid_root_skip => 9
    add_field => { "device_ip" => "%{[@metadata][host_address]}" "device_name" => "Casablanca 20251 MA5600T" "location" => "33.566214, -7.632437"}
  }
}

filter {

split {
   field => "ifTable"
}

#dynamically move nested key value to root level of the ifTable object
ruby {
        code => "
            event.get('ifTable').each { |k, v|
                event.set(k,v)
            }
            event.remove('ifTable')
        "
}

mutate {
        convert => {
          "ifInOctets" => "integer"
          "ifOutOctets" => "integer"
          "ifSpeed" => "integer"
        }
    }

#query the latest counters of the interface from elasticsearch
elasticsearch {
            hosts => ["https://localhost:9200"]
            user => "elastic"
            password => "changeme"
            cacert => "/opt/logstash_snmp/ca.crt"
            index => "snmp-logs-metrics-*"
            query_template => "query_ifIndex_template.json"
            fields => { "@timestamp" => "lastPollCycleTimestamp" "ifInOctets" => "lastPollCycleIfInOctets" "ifOutOctets" => "lastPollCycleIfOutOctets"}
      }

if ([lastPollCycleTimestamp] =~ /.+/ ){
date {
    match => [ "lastPollCycleTimestamp", "ISO8601" ]
    target => "lastPollCycleTimestamp"
  }
} else {
    mutate {
            copy => { "@timestamp" => "lastPollCycleTimestamp" }
            copy => { "ifInOctets" => "lastPollCycleIfInOctets" }
            copy => { "ifOutOctets" => "lastPollCycleIfOutOctets" }
    }
}

mutate {
        convert => {
          "lastPollCycleIfInOctets" => "integer"
          "lastPollCycleIfOutOctets" => "integer"
        }
    }

#compute Bandwisth utilization
ruby {
    init => "require 'time'"
    code => "
                event.set('timeDifference', Time.parse(event.get('@timestamp').to_s) - Time.parse(event.get('lastPollCycleTimestamp').to_s));
                if (!event.get('timeDifference').nil? && event.get('timeDifference') > 0 && !event.get('ifSpeed').nil? && event.get('ifSpeed') > 0)
                    event.set('inboundUtilization', (event.get('ifInOctets') - event.get('lastPollCycleIfInOctets')) / (event.get('timeDifference') * event.get('ifSpeed')));
                    event.set('outboundUtilization', (event.get('ifOutOctets') - event.get('lastPollCycleIfOutOctets'))/ (event.get('timeDifference') * event.get('ifSpeed')));
                elsif (!event.get('ifSpeed').nil? && event.get('ifSpeed') > 0)
                    event.set('inboundUtilization', (event.get('ifInOctets') - event.get('lastPollCycleIfInOctets')) / event.get('ifSpeed'));
                    event.set('outboundUtilization', (event.get('ifOutOctets') - event.get('lastPollCycleIfOutOctets'))/ event.get('ifSpeed'));
                else
                    event.set('inboundUtilization', (event.get('ifInOctets') - event.get('lastPollCycleIfInOctets')));
                    event.set('outboundUtilization', (event.get('ifOutOctets') - event.get('lastPollCycleIfOutOctets')));
                end
        "
}
mutate {
        remove_field => [ "@version" ]
      }

}

output {
   elasticsearch {
    hosts => ["https://localhost:9200"]
    user => "elastic"
    password => "changeme"
    cacert => "/opt/logstash_snmp/ca.crt"
    ssl => true
    index => "snmp-logs-metrics-%{+YYYY-MM-dd}"
    action => "index"
}
}
The final result should looks like this :
{
  "@timestamp": "2020-12-21T15:01:44.441Z",
  "device_name": "Casablanca 20251 MA5600T",
  "device_ip": "10.10.10.11",
  "location": "33.566214, -7.632437",

  "ifIndex": 6,
  "ifDescr": "Vlan203",
  "ifType": 6,
  "ifPhysAddress": "00:01:97:22:a3:b8",
  "ifSpeed": 1000000000,
  "ifInOctets": 7144724480,
  "ifOutOctets": 4734465402,
  "ifSpecific": "0.0",
  "ifOutUcastPkts": 15922017,
  "ifOutDiscards": 0,
  "ifLastChange": 5500,
  "ifOutQLen": 0,
  "ifMtu": 1500,
  "ifInUnknownProtos": 5546,
  "ifOutErrors": 0,
  "ifInDiscards": 141,
  "ifOutNUcastPkts": 0,
  "ifOperStatus": 1,
  "ifAdminStatus": 1,
  "ifInUcastPkts": 193985,
  "ifInNUcastPkts": 193263846,
  "ifInErrors": 0,

  "lastPollCycleTimestamp": "2020-12-21T15:00:44.348Z",
  "lastPollCycleIfInOctets": 9046986666,
  "lastPollCycleIfOutOctets": 6710683681,
  "timeDifference": 60.093,
  "outboundUtilization": 0.0026216171767094337,
  "inboundUtilization": 0.0029433305376666166
}
NB
Make sure your poll cycle time interval should be more than the index.refresh_interval
